Page 1 of 1
Photogrammetric Cloud vs LiDAR Cloud
Posted: Wed Dec 02, 2015 1:40 pm
by malloreddu
Hi everyone,
i'm sorry if i'm asking for an obvious question.
I've done a survey of an old church, with two different metods, the first one it's by taking photos from a drone, the second with laser scanning
So i've one point cloud created on photoscan processing the photos i've taken. CLOUD A
the second one it's a point cloud created merging all the point clouds of the scans. CLOUD B
i've even a 3rd cloud that's created merging CLOUD A with CLOUD B.
Now i want to do an analysis of CLOUD A, and CLOUD B, i'm interested to see the distribution of point distance in each cloud so how the density change in every part of the church.
you can see an example of what i'm trying to do in the attachment.
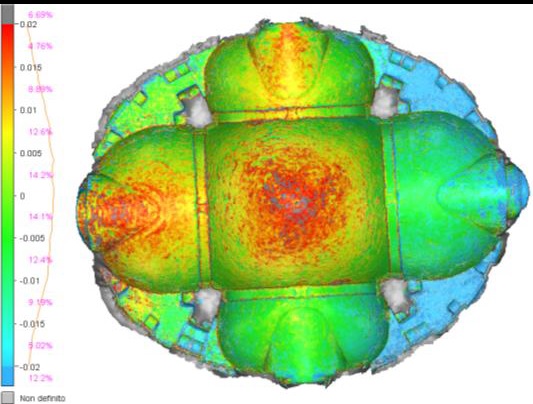
- Example
- Immagine.jpg (70.47 KiB) Viewed 10917 times
Can you help me?
thank you for your help
Re: Photogrammetric Cloud vs LiDAR Cloud
Posted: Wed Dec 02, 2015 5:53 pm
by daniel
Sorry I'm not sure to understand everything.
If you want to compute the density of a cloud you can use this tool:
http://www.cloudcompare.org/doc/wiki/in ... le=Density
And if you want to compute the distances between two clouds, then you can use this tool:
http://www.cloudcompare.org/doc/wiki/in ... d_Distance
But don't hesitate to ask for more informatin if I missed the point.
Re: Photogrammetric Cloud vs LiDAR Cloud
Posted: Thu Dec 03, 2015 3:51 pm
by malloreddu
first of all thank you for the answer and sorry for my english.
If you look to the image in my first post, it shows a map of the distance between the points in the cloud and on the left we can see the % of points in that distance range (i.e. 14.2% of the points are between 0 and 0.005)
I want to do the same thing with two different clouds.
I don't understand if i've to use distance between two clouds to do that, i've read all the wiki but i don't understand if this tool tell me what i want or if it tell me only the distance between the two clouds that it's useless to define the quality of the two clouds...
thank you and if you want other explaination just tell me :D
Re: Photogrammetric Cloud vs LiDAR Cloud
Posted: Fri Dec 04, 2015 7:12 am
by daniel
What you describe is simply the histogram.
You can display the same kind of histogram as in your screen capture by displaying the color scale associated to the distances field (see the 'show' checkbox in the 'Color scale' section of the cloud properties).
But you can also display a clearer view of the histogram with 'Edit > Scalar fields > Show histogram'. And in the latest versions of CC you can export it to Excel, etc. (as a CSV file)
Re: Photogrammetric Cloud vs LiDAR Cloud
Posted: Sat Dec 05, 2015 2:28 pm
by malloreddu
OK i'm trying to do this, but in the scalar fields panel i can choose only between: none, intensity,point source ID, scan direction.
Even in histogram i see a graph of the intensity and not of the distance
i give you a screenshoot
Sorry again for the obvious questions
Re: Photogrammetric Cloud vs LiDAR Cloud
Posted: Sun Dec 06, 2015 1:59 pm
by malloreddu
the point is, that i don't want to show the distance between the two clouds.
what i want to show, like in the image that i've posted in the first post, it's the distance of each point of the cloud from the neighbours points.
for example, if i've 10% of the points that have a distance from the neighbours of 1 cm
i've 40% of the points that have a distance from the neighbours of 0,2 cm
and so on...
Re: Photogrammetric Cloud vs LiDAR Cloud
Posted: Sun Dec 06, 2015 3:58 pm
by daniel
This looks like the histogram of the density... Simply compute the density (Tools > Other > Density) and then display the histogram?
Re: Photogrammetric Cloud vs LiDAR Cloud
Posted: Mon Dec 07, 2015 9:02 pm
by orinn
Maybe they need to be able to see numbers in the histogram?
I agree with Daniels solution, what your describing is solved by density analysis.
Re: Photogrammetric Cloud vs LiDAR Cloud
Posted: Mon Dec 07, 2015 10:12 pm
by daniel
The 'Histogram view' (Edit > SF > Show histogram) gives a better vision of the histogram (population per class, etc.).
Moreover if one click anywhere on the histogram, a line appears where the mouse is clicked with the current class value as well as the percentage of points below.