and thanks for the great program, Daniel! This is very useful for point cloud processing.
I'm quite new with CloudCompare, so forgive me.
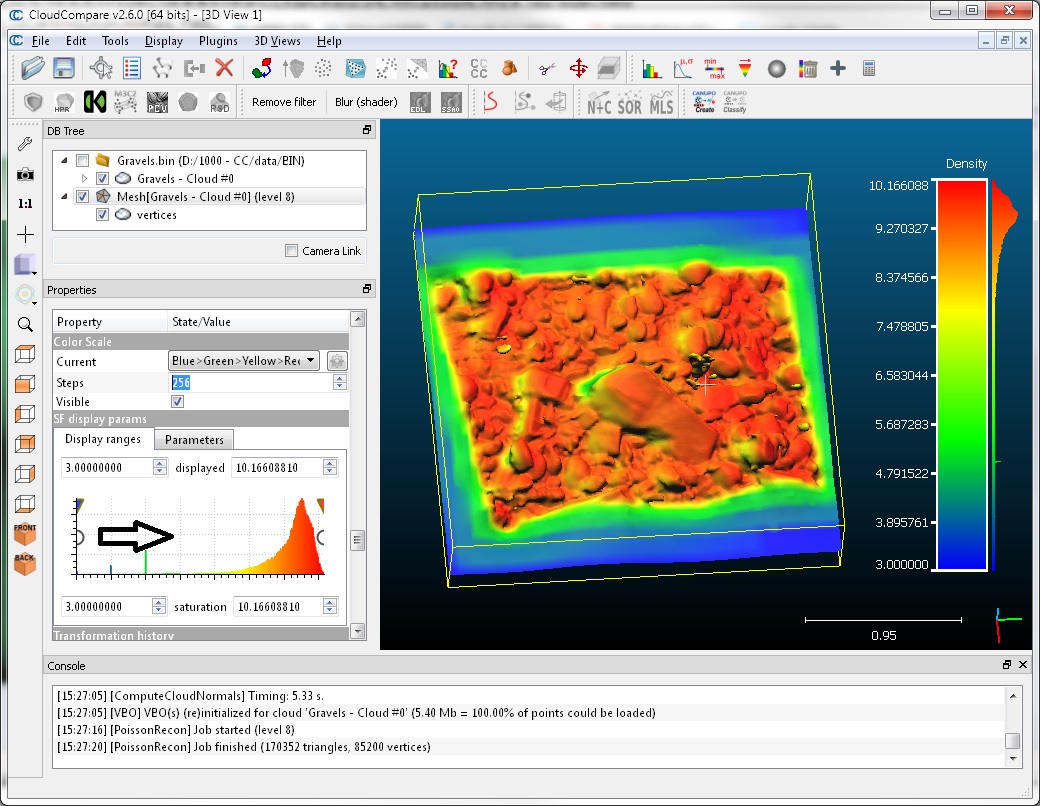
I have a question regarding to contour lines and scalar fields (Z value indicator). I have a terrain point cloud and I've created colorized contour lines (plot) for it.
However, I don't see any option for using scalar field (Z scale) with the created contours. Is there a way to display the Z scale for contours as seen here?:
I see this quite critical feature in my current workflow.
As far as I've familiarized myself with the program, it seems that scalar field is only usable with meshes/point clouds but not with contour lines. Am I right? What shall I do to get this work?
Any help is appreciated. :)
Edit: Topic title Contours & Scalar field -> Contours & Z value indicator
